Turning point for incentives to invest in residential batteries
By Mustafa Kaka (Economist) and Russell Pendlebury (Economics Director)
Falling battery installation costs, longer warranty periods, and a greater incentive to store and utilise energy from a home installed battery mean that between now and 2025 battery installation may become economic for many households. As yet only a fraction of Australian solar households have batteries installed.
Introduction
With the current state of domestic and international energy markets, many consumers are looking for ways to lower the cost of energy. The purpose of this piece is to highlight trends in residential battery costs and how they may intersect with growing incentives for consumers to store and utilise their own energy from a battery. Falling battery costs and longer warranty lifetimes, accompanied by changes to solar feed-in tariffs and tariffs for using energy in peak periods, are changing the incentives to invest in residential batteries.
The piece sets out changes in the incentive to store energy, through changing solar feed-in tariffs, export charges and peak energy usage charges, as well as changes in the cost and lifetime of residential batteries. It also looks at the current trends in residential battery installations when compared to existing rooftop PV installations.
For a solar panel owner, the benefits of owning a battery are increasing. The net benefit increased from 0.15-0.20 $/kWh in 2020 (the difference in the value of the generated energy from solar versus the cost of energy to that consumer during peak periods) to an average of 0.24 $/kWh in 2021. This trend is forecast to continue as solar feed-in tariffs fall, and export charges are introduced. There is a potential net benefit of 0.30 $/kWh in 2024/25. As a consequence, payback periods for a battery investment are decreasing with a payback period for a battery in 2016 of 19 years, falling to 10 years in 2022 and expected to be only 7.5 years in 2025. With current warranty periods for an average battery at 10 years, batteries may become economic for many households by 2025.
We can also think about this in terms of the levelised cost of storage (LCOS), or the cost of kWh electricity discharged from a battery when accounting for all costs incurred, and energy produced throughout the lifetime of the device. This can be compared to the net incentive between what the consumer received for their solar output and what they pay for peak energy, i.e. when they would use their battery output. This cost has reduced dramatically, from 0.80 $/kWh in 2016 to 0.30 $/kWh in 2021, whilst slightly increasing in 2022 to $0.39 $/kWh due to higher lithium and nickel prices and worldwide supply-side issues.
The downward cost trend for batteries is expected to continue in the future. The current lowest offer from a premium manufacturer is 0.18 $/kWh and an increasing number of manufacturers are offering systems below 0.30 $/kWh. As these trends continue, it is expected that batteries will become increasingly commercial investments for consumers. Furthermore, any increase in energy costs to consumers, due to higher commodity prices or other global market changes, will increase the incentive in the short term.
This piece uses data sourced from Energy Made Easy, the Clean Energy Regulator and residential battery data from Solar Quotes.
The benefits of owning a battery are increasing
As solar feed-in tariffs fall, and as export charges are introduced from 2024, storing solar energy for use in peak periods becomes more attractive. The trend of falling solar feed-in charges shown below may well continue with increasing rooftop solar PV forecast over the next twenty years. (AEMO forecasts in the ISP step-change scenario show over 30 GW of rooftop PV by 2030, from 15 GW today).
The incentive to invest in a battery is driven by the return to the end-user switching from solar export to instead storing the energy and using the stored energy to offset their own peak consumption when energy is expensive. The table below shows the incentive for each distribution network. That is, the owner:
- avoids high TOU import charges (average 0.31/kwh), but
- loses out on FiT export payment (average 0.068/kwh in 21/22),
- giving a net incentive, relating to the avoided network charges alone (0.243/kwh in 21/22).
Additionally, the battery owner would avoid all other retailer charges associated with consuming from the grid, most notably wholesale costs.
Table 1: Net incentive of owning a battery by DNSP
|
|
Solar TOU FiT - $/kWh 20/21 |
Solar TOU FiT - $/kWh 21/22 |
Peak TOU Tariff - $/kWh 21/22 |
Net Incentive - $/kWh 21/22 |
Net Incentive - $/kWh 24/25 Post Export Charges |
|
Ausgrid |
0.070 |
0.050 |
0.448 |
0.398 |
0.443 |
|
Ausnet |
0.102 |
0.067 |
0.314 |
0.247 |
0.301 |
|
CitiPower |
0.102 |
0.067 |
0.233 |
0.166 |
0.219 |
|
EndeavourEnergy |
0.070 |
0.050 |
0.314 |
0.264 |
0.309 |
|
Energex |
0.060 |
0.050 |
0.265 |
0.215 |
0.260 |
|
EssentialEnergy |
0.070 |
0.050 |
0.328 |
0.278 |
0.323 |
|
Evoenergy |
0.095 |
0.095 |
0.341 |
0.246 |
0.313 |
|
Jemena |
0.102 |
0.067 |
0.258 |
0.191 |
0.245 |
|
Powercor |
0.102 |
0.067 |
0.240 |
0.173 |
0.226 |
|
SAPower |
0.105 |
0.105 |
0.418 |
0.313 |
0.385 |
|
TasNetworks |
0.094 |
0.065 |
0.299 |
0.234 |
0.286 |
|
UnitedEnergy |
0.102 |
0.067 |
0.264 |
0.197 |
0.250 |
|
Total Average |
0.090 |
0.068 |
0.310 |
0.243 |
0.297 |
Note: incentives shown for grid-connected consumer. This analysis assumes a representative customer who already has solar 5KW PV system installed, load of 5000 kWh, a reduction in solar feed-in tariffs in 24/25 and an export charge of 0.02 $/kWh. Actual results will vary by network region and by customer panel and load configuration. The analysis uses TOU peak tariffs from 2021/22 which are updated as of June 2022. The current market conditions have slightly increased TOU peak tariffs for 2022/23 market offers as of September 2022.
The incentive to invest in a battery is driven by the return to the end-user switching from solar export to instead storing the energy and using the stored energy to offset their own peak use consumption when the TOU tariff is high. This analysis assumes the customer still pays the fixed daily supply charge but avoids all variable peak wholesale and network costs. If the cost per warranted hour of a battery is lower than this incentive, it is commercially positive for the consumer to install a battery, provided they have an installed PV system. This will be explored in the section below.
The cost of owning a battery is decreasing
Residential household batteries typically are sold as standalone systems or as ‘all in one’ units whereby the inverter is attached. For the purpose of this analysis, we are assuming the inverter cost is considered within the installation cost. To undertake the analysis of the trends in residential battery prices data was sourced, collected and cleaned from Solar quotes.
In this analysis, a time series comparison of the total capital cost of batteries divided by the total energy that can be cycled through the battery over its warranty lifetime is conducted. This gives a $/kWh cost of the battery and is referred to as cost per warranted kilowatt-hour ($/kWh) or the Levelised cost of energy. This is then directly compared to the $/kWh benefit from having a battery.
The declining $/kWh costs have been achieved through a combination of:
- The decreasing average cost per battery unit
- The increasing average kWh size per battery unit
- The increasing warranted number of cycles of the battery.
If a battery is discharged approximately once a day, this number indicates which battery system is the most cost-effective. Once a battery’s price per kWh drops below the incentive calculated in the first section (the difference between peak energy cost drawn from the grid and the value the household gets from exporting energy in the mid-day solar peak), battery storage is likely to be a beneficial investment for households with or shortly installing, suitably sized solar PV. The average cost per warranted hour ($/kWh) has halved from $0.80 in 2016 to $0.39 in 2022. While there is a slight uptick in 2022, the overall trend is steeply down over the last five to six years.
Figure 1: Average of cost per total warranted kWh (1 cycle per day) by year

This number is likely to continue to decline as more batteries enter the market, systems become more energy-efficient, and the industry attains greater scale with greater demand. The average life of a battery is also increasing when comparing warranty periods from 2016 to 2022. If batteries had a similar lifetime to solar panels, consumers would be more inclined to purchase a battery or bundle both systems in their purchase.
Payback periods for consumers soon falling inside battery lifetime
A key metric in accounting for whether a battery is a sound investment for consumers is the payback period. The warranty period for an average battery is 9.7 years in 2022. Thus, for a battery system to be cost-effective, the investment must pay back its cost within 9.7 years. To understand the payback period for a typical battery over time, some assumptions are made in addition to using the residential battery data for upfront capital costs and the expected life of a battery. These assumptions include:
- 5KW Solar system already installed
- Load of 5000kWh
- Discount rate of 7%
- Installation costs in 2022 and 2025 remain the same
- Life of an average battery in 2022 and 2025 remains the same
The payback period of an average battery is shown below along with how it compares to the life of an average battery based on its warranty period. The trend since 2016 is also shown in the following figure along with the expected turning point between 2022 and 2025.
Table 2: Payback period of a typical residential battery
|
Year |
Installation Cost ($) |
Net Incentive ($/kWh) |
Payback Period (Years) |
Life of an average battery (Years) |
|
2016 |
10,349 |
0.20 |
19.05 |
8.35 |
|
2022 |
8,491 |
0.24 |
10.11 |
9.79 |
|
2025 |
8,491 |
0.30 |
7.47 |
9.79 |
Note: The usable capacity of the battery is 8kWh based on current market data of the average battery
Figure 2: Payback period and life of an average battery
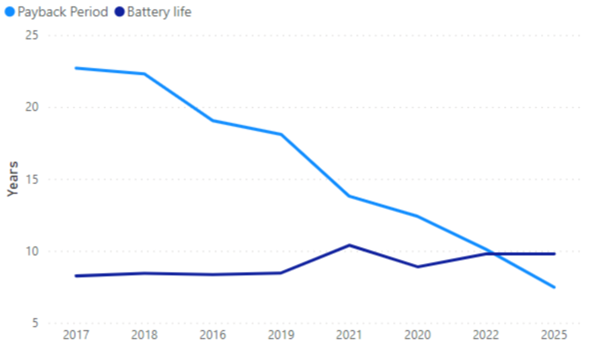
Note: The usable capacity of a battery for all years is assumed to be 8kWh based on market data
The figure and table above show that the payback period for batteries has been decreasing since 2016 and is expected to decrease further by 2025 as the net incentive increases with lower solar feed-in tariffs and solar export charges. If the trend of longer warranty periods continues, batteries will become commercially attractive investments by 2025.
Key competitive batteries on the market
There are some reputable systems that are already competitive with grid supply. The Sungrow SBR HV battery has a payback period of 7.1 years, a cost per warranted hour of $0.18 $/kWh, an installation cost of $8184 and a usable storage capacity of 12.8kWh. This battery is also off-grid capable.
The Tesla Powerwall, with the highest market share, has a cost per warranted hour of $0.31 $/kWh, an installation cost of $12,750 and a useable capacity of 13.2 kWh. This is not yet low enough in 2022 to justify investment for a user who is connected to the grid on the basis of a commercial return. The payback period for a Tesla Powerwall is below:
Table 3: Payback period for a Tesla Powerwall
|
Year |
Installation Cost ($) |
Net Incentive ($/kWh) |
Payback Period (Years) |
Life of Tesla Powerwall (Years) |
|
2016 |
9,000 |
0.20 |
14.6 |
10 |
|
2022 |
12,750 |
0.24 |
20.1 |
10 |
|
2025 |
12,750 |
0.30 |
13.4 |
10 |
A Tesla Powerwall is still therefore not expected to be cost saving for consumers in 2025, however any reductions in installation costs and increases in the life of the battery could make it more attractive.
Only a fraction of solar households have batteries installed
There are around 3.19 million total solar systems installed on residential and small business customers in Australia. Based on ISP projections from AEMO, this number is expected to increase by 37% by 2024/25 and 83% by 2029/2030.
Figure 3: Total solar PV systems installed in Australia

Battery systems are not yet as numerous as rooftop PV systems. But, over the last 7 years we have seen a significant uptake in the residential small-scale battery systems installed. From data provided by the clean energy regulator, the total registered small-scale systems installed have increased, to 50,270 systems installed in Australia as of August 2022.
Figure 4: Total residential batteries installed in Australia
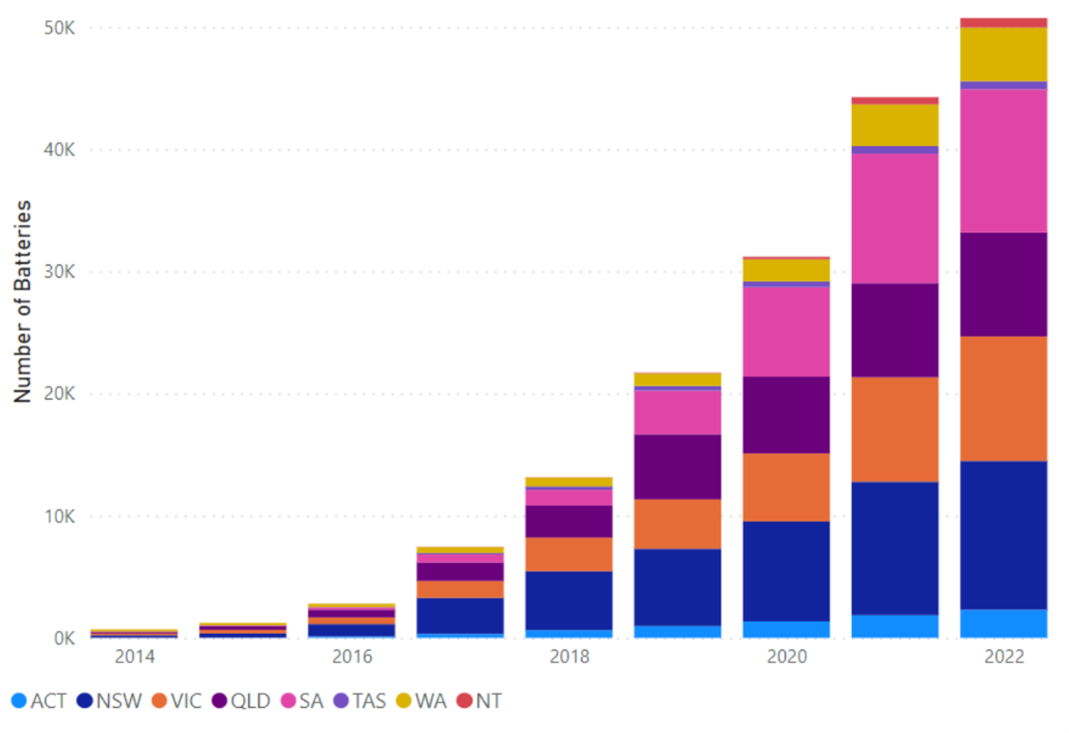
Currently only 1.6% of households with rooftop PV have installed a battery.
Conclusion
Residential battery costs are falling, with warranted lifetimes increasing. The incentive to store low-cost solar energy and use this energy in peak periods is also increasing. By 2025, battery installation may be economic for a number of households with solar PV installed. This will have implications for consumers and for the wider grid as the system transitions and greater amounts of DER, EVs and other new technologies are deployed across distribution networks in the NEM.